Artifact Description:
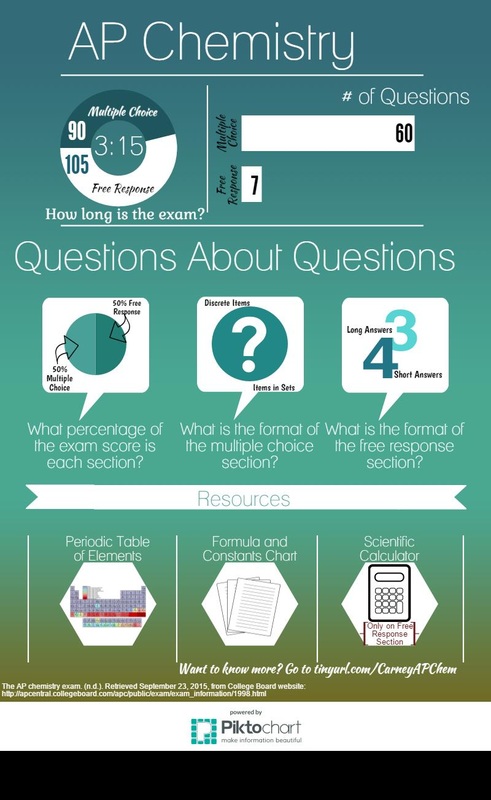
This infographic displays information to students about the AP Chemistry exam. It answers repeated questions like how long is the exam, what resources are available, what is the grading like, or what is the format of each section. It also contains a link tinyurl to the College Board's website with all the details of the exam. Component 3A is about clearly communicating with students. This infographic provides a clear explanation about details of the exam. To create this infographic, I looked at the College Board's website to find the details and decided which information is not part of instructional time, but students still want to know. This is the information that students can look at when they want to know without interrupting instructional time.
Artifact Reflection:
If I were to redo this assignment, I would like to make one about the AP Calculus exam because that will relate more to what I am teaching. The layout of the information worked out nicely and I think that the order of the information is logical and eye catching. In my future classroom, I can use an infographic to show the same information but for the AP Calculus exam or to demonstrate where math is needed in careers or everyday life. Infographics could also be used for fun facts or to show class progress throughout the year. This infographic can relate to educational psychology principles from Howard Gardner about multiple intelligences. Within multiple intelligences, infographics help the visual-spacial learner.
Danielson, C. (2007). Enhancing professional practice a framework for teaching (2nd ed.). Alexandria, Va.: Association for Supervision and Curriculum Development.
